Embed a chart on any site
A published Kitegraph chart is one embed snippet. It carries its own fonts, colors, and data, so it drops into any page that accepts HTML: WordPress, Ghost, Substack, Notion, or a hand-built site. This is the chart from Annotate and animate, embedded here:
Publish the chart
On the editor's Publish step, Publish chart creates two stable links (a share page and the embed) plus the embed code. Publishing is free with an account, and the links never change, even when you republish.
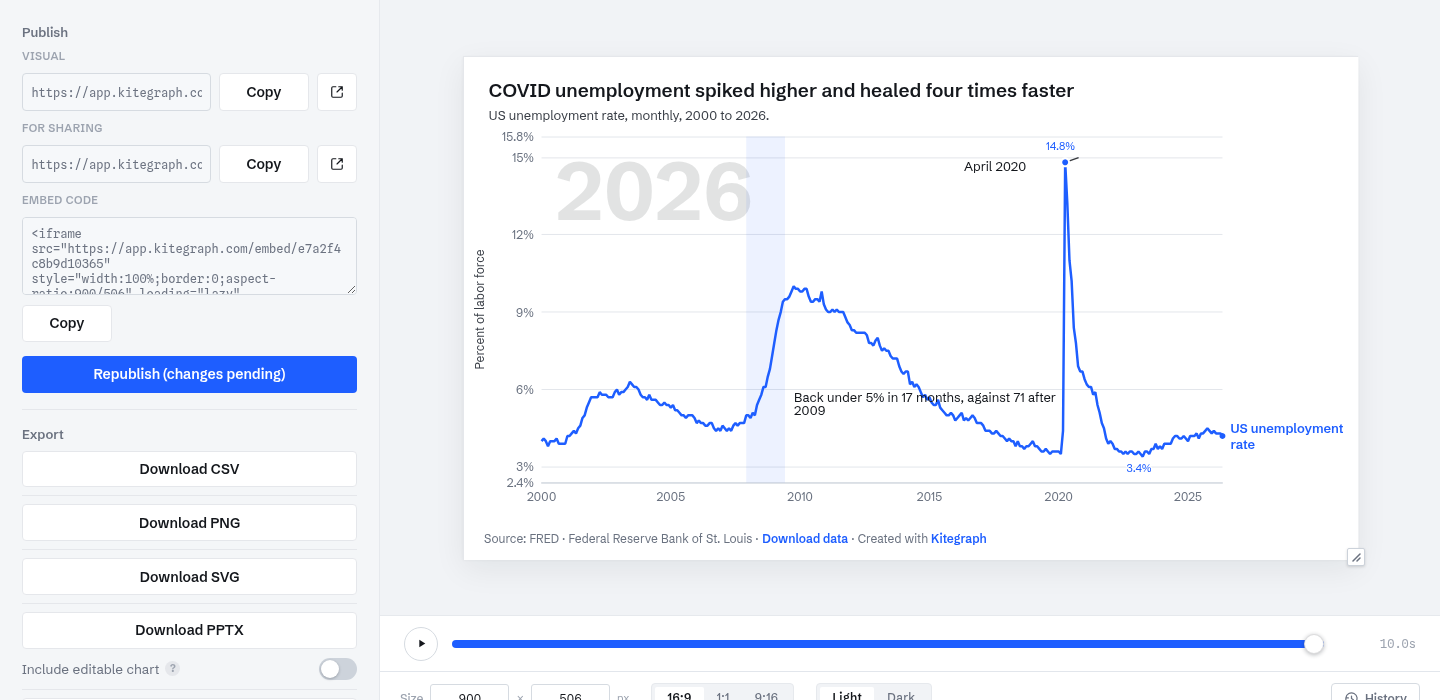
Copy the embed code
The embed code is two lines:
<iframe src="https://app.kitegraph.com/embed/e7a2f4c8b9d10365"
  style="width:100%;border:0;aspect-ratio:900/506"
  loading="lazy" allowfullscreen></iframe>
<script src="https://app.kitegraph.com/embed.js" async></script>
The iframe is the chart, with the aspect ratio you designed at as its fallback shape. The script is a small helper that lets charts on the page size their frames to their content; it loads once no matter how many charts the page embeds, and if a CMS strips it, the iframe still works on the aspect-ratio fallback.
Paste it into your CMS
- WordPress: add a Custom HTML block and paste the code.
- Ghost / Substack: use the HTML card in the post editor.
- Notion: type /embed and paste the embed URL on its own.
- Plain HTML: paste the snippet where the chart should sit.
The chart at the top of this page is exactly that: this article's own copy of the snippet.
How it resizes
The chart lays itself out from real pixels rather than scaling a picture. At 400 pixels wide it re-plans its labels, legend, and ticks for 400 pixels; on a wide article page it uses the room, with the type staying readable at its designed size. Charts whose height should follow their content (long bar lists, for instance) tell the page their height through the helper script instead of being squeezed into a fixed box.
Live or frozen
Charts built on library statistics or live source picks stay connected to the data and update as the source publishes new periods; the chart above will chart new months without this page changing. Pasted and uploaded data is baked in and stands still until its author edits it.
Republishing never changes the link. Edit the chart, hit Republish, and every page already embedding it shows the new version. No CMS edits needed.